How to configure Electricity or Water Reading Logs?
Energy Consumption tracking is important to analyze:
- Comparing energy consumed during different days, months & dates
- Come up with energy saving strategy
- Predict energy demand in advance
- Analyze where most energy requirements are.
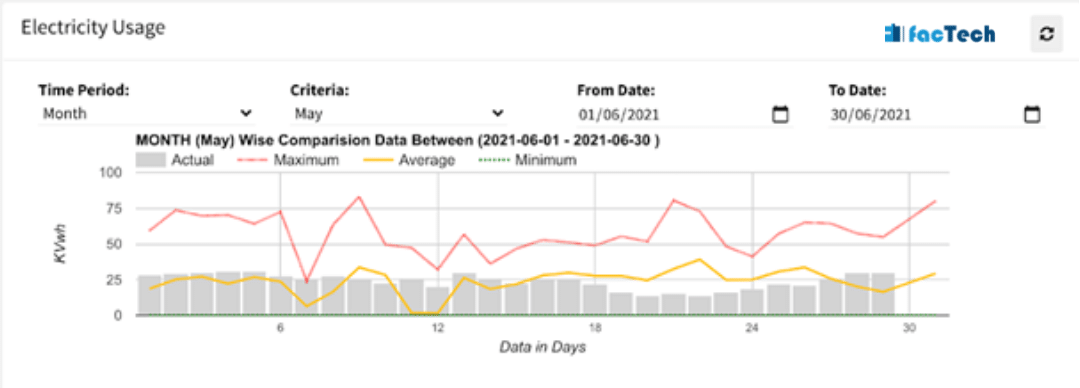
Below is snapshot of Electricity usage chart. After that steps are given how to populate this analytics along with log sheets.
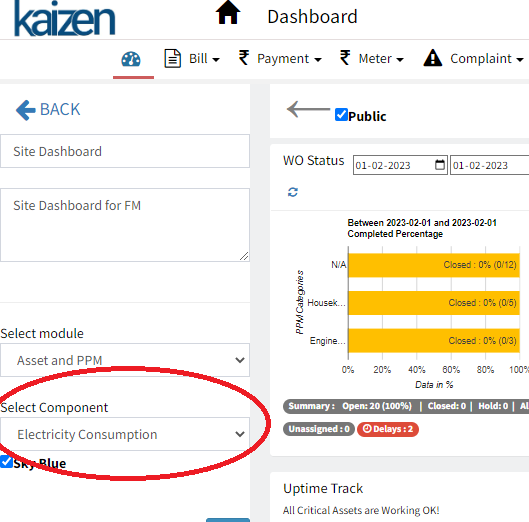
The electricity Usage dashboard component can be added by Admin in her dashboard (Dashboard -> Edit ) by selecting Electricity Consumption as shown below
Step 1.
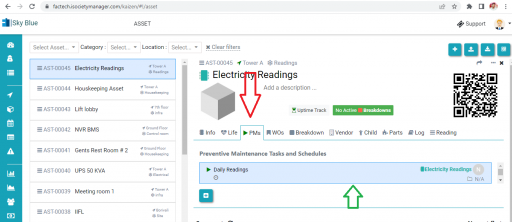
Log in to factech.co.in and click on Asset & PPM. (Refer to Screenshot).
Step 2.
You can add logs either to an Asset or to a Schedule directly. Below screenshot shows Asset -> PM
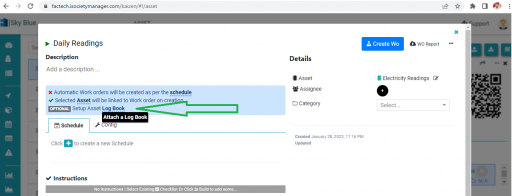
Step 3.
Click on the Log Book. ( Refer to Screenshot)
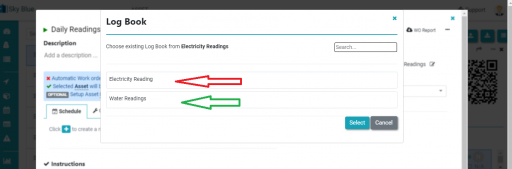
Step 4.
Select the type of Log. ( Water or Electricity)
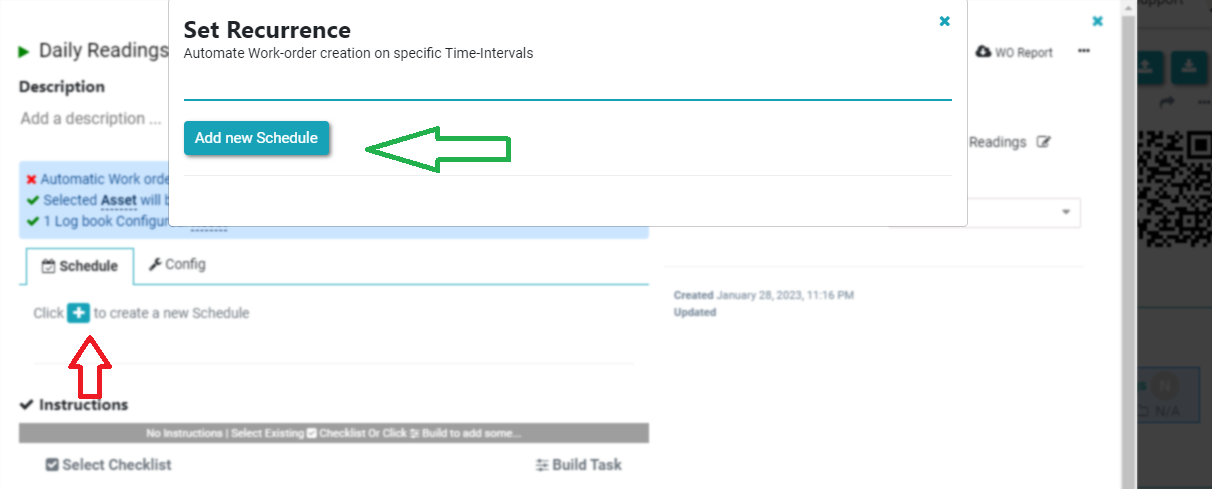
Step 5.
Add frequency for readings, like every hour, daily, etc.( Refer to screenshot)
The Logs have been updated successfully. You can also attach the checklist with the Logs simultaneously.
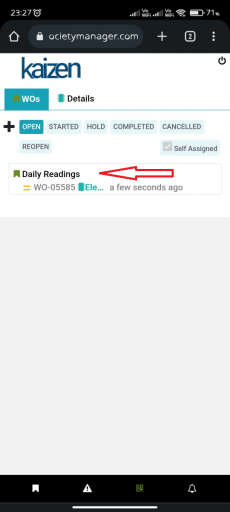
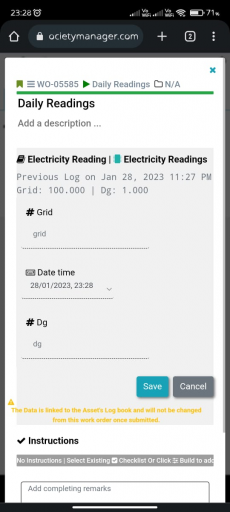
Now a technician can scan and fill in the Readings. ( Refer to Screenshot)
Note:- The logs can be used along with Log sheet. In similar fashion Water Consumption chart can be populated.
Thank You!!


Leave a Reply
You must be logged in to post a comment.